MIT Sloan Sports Analytics Conference 2013: Soccer Analytics Panel


Panelists : Chris Anderson, Albert Larcada, Blake Wooster, Jeff Agoos

The makeup of this year’s panel is very different from that of Soccer Panel at SSAC 2012. Dominated by “club insiders” last year, this year’s panel had a mix of “outsiders” like Chris Anderson, Blake Wooster from Prozone represented the data companies, Albert Larcada from ESPN coming from media and Jeff Agoos, a former player and Technical Director of MLS.

The Ballroom was almost full and this was a bigger ballroom than that of the last year’s conference. (My totally un-scientific method of measuring crowd sizes puts “almost full” > “75% full of last year”)

Marc Stein moderated the panel as was the case last year.

soccerpanel

This year’s panel took a completely different track compared to the panel from last year. Last year it surrounded around how analytics is used, where it is useful and the importance of context and trust. The biggest challenge cited in 2012 was the availability of good data to work with.  This year it centered more around how much analytics is used by managers, metrics, visualizations – use of analytics in the media and trust (a repeat theme from year).

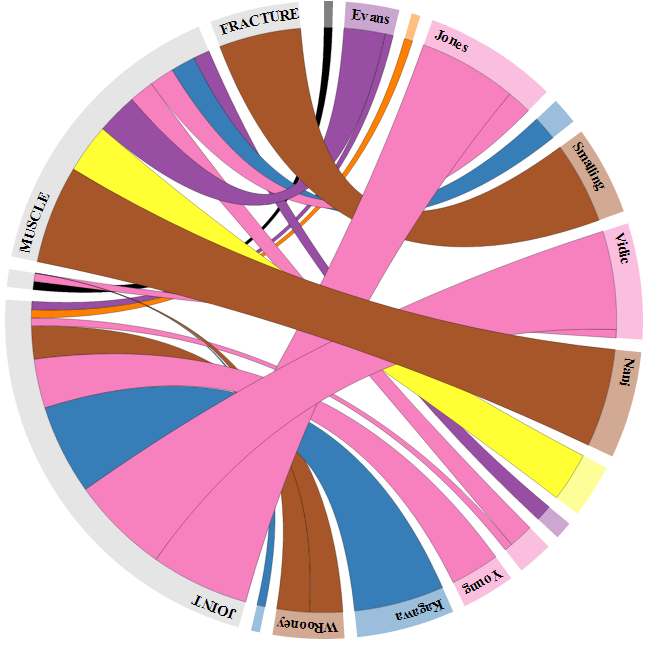
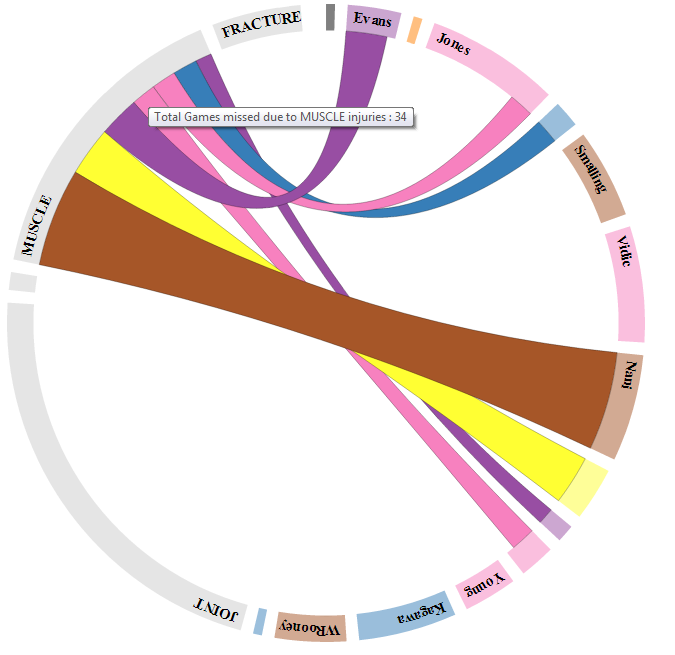
The panel started off with a historic perspective of soccer analytics from Chris. I thought it was a very good beginning that gave the audience an idea of how far we have come. Albert’s examples of using heatmaps of Messi and Ronaldo in the build-up to the “Clasico” in SportsCenter showed how data is being used to tell a story. The challenge in a scenario like SportsCenter is that the announcers need to be able to explain the graphic and tell the story in less than 10 seconds. Choosing the right type of visualization is key. I also liked the idea of “visualization is analytics” quote from Albert. All visualizations are an approximation of the raw data. If done right, they can tell a story not just in media but also inside a soccer club.

The big questions

  1. How much analytics is being used by the club managers?
  2. What are the challenges in making the coaches use analytics?
  3. Metrics – what do we have today?

How much analytics is being used by the club managers?

Chris tried to answered this based on his experience working with clubs as a consultant but the viewpoint of an “insider” (like an analyst at a club) citing examples where analytics has been used by a manager successfully would have been a good counter-balance.  It is always tough balancing act to not reveal confidential details and have a frank discussion but I felt that the club angle was addressed better in last year’s panel. West Ham United’s manager Sam Allardyce talking about how he uses analytics is a good example.

What are the challenges in making the coaches use analytics?

There was some great discussion on this one.  Coaches have a lot at stake and they may not be willing to use something new unless they know (with a high degree of confidence) or trust that it will help them but they won’t know for sure if it will be useful unless hey use it. The classic chicken and egg. A great example was the importance of survival in a promotion-relegation environment and how that pushes managers and front-offices more towards short-term thinking and immediate results.

Daryl Moorey, the GM of Houston Rockets and a co-chair of the SSAC brought up a great point in the “Revenge of the Nerds” panel about how the front office needs to support and persist with analytics. Managers may not trust it right away but if they find it useful over a period of time they will eventually come around.

Blake had a point when he stressed that the onus is on the analyst to communicate the value of analytics to the coach. If the coach doesn’t see value in it, it is probably because the analyst didn’t do a good enough job of conveying the message.

In the talk “Why we don’t understand Luck” by Michael Mauboussin one of my favorite talks of the conference, Michael stressed the importance of evaluating things based on the process (which is very hard to do) rather than the outcomes (which is easy and what we do normally).

I believe that analytics is being used differently in different clubs (hardly surprising). It has a complimentary role as “another tool” in the overall toolkit for success.  The two key themes that resonated across the 2-day conference “communicating the message” and “winning the trust of coaches/decision-makers” are very important.

Metrics – what do we have today?

This is probably one of the most debated aspect of soccer analytics today. What metrics do we have? What is the equivalent of Baseball’s WAR in soccer? There is a lot to gain from knowing the process of how analytics and metrics work in other sports but every sport is unique and presents its own challenges. It is a fact that we haven’t been able to model soccer matches as well we would love to. Albert brought up a great point about how the paucity of scoring on soccer makes it much harder to model than almost every other team sport. We haven’t yet come up with a formula that tell us how to win a game or score a goal. That is because there are many ways to win a soccer game. Different coaches employ different systems. A metric/KPI valued highly in one system might not matter at all in another system. For example, speed on the ball and accurate long-balls might be very important in a counter-attacking system but may not be that important in a short passing system.


Charles Reep, probably the first soccer analyst, concluded that most goals were scored from fewer than three passes: therefore he concluded it was important to get the ball quickly forward as soon as possible.

While his statement might still hold true, the “How?” is the key question. The answer is not as straightforward. The quickest way to move the ball is for the goalkeeper to hoof balls upfield and we know that it doesn’t work most of the time.

I believe the availability of spatial XY-data + data from camera tracking systems (installed in most of the stadiums around the world today) in conjunction with video has helped in answering the “How” better. But we still have a long way to go.

As Chris pointed out at the very beginning of the panel – This is not a revolution but an evolution. We are constantly evolving.

A few more of my thoughts in a podcast with Richard Whittall  editor of the The Score Media’s Counter Attack blog

Suggestions for the next year’s panel

  1. I felt that the composition of the 2012 and 2013 panels were at the extremes in terms of “club insiders/outsiders”. A panel with a mix of the two groups would probably be more useful.
  2. Panel formats don’t lend themselves very well to 1-on-1 dialogue and interaction. An online Q & A chat session with the panelists during the conference is a good thing to try. I got similar feedback from a few others who attended the conference.
  3. Have Big Sam on the panel! – Seriously, having a manager who has used analytics and is willing to talk about it would elevate this panel to a whole another level. I am aware that EPL will be in season, but technology gives the option to have someone participate remotely.

I have another post summarizing my views on the other panels I attended coming up in a few days.

Links

Official website Sloan Sports Analytics Conference

Richard Whittall’s thoughts on the Soccer panel

Zach Slaton’s Summary of the SSAC 13

Mitch Lasky’s impressions of the conference

Sports Hack Day Project


I have been busy ever since I started working for the Seattle Sounders about a month ago. It has been great so far. We are less than a month away from the season kick-off. I am very excited, to say the least.

Coming up in a few weeks is the Sloan Sports Analytics Conference in Boston. Last years conference had a profound impact on me. More about that in another post.

This weekend I participated in the 1st ever Sports Hackday in Seattle. The idea of learning something new, meet like-minded people and a chance to avoid the endless Superbowl pregame show were enough motivation to sign-up. The Hackday was very well-organized. Kudos to the organizers and sponsors. We started off Friday night with introductions and forming teams. Our team “Submarino” constituted of Sarah, AdamMatt and I. We had a few ideas going into the Hackday. After a brief brainstorm we decided on looking at the impact of injuries to soccer clubs.

Sunday morning during the integration phase a few hours before the demo

Sunday morning during the integration phase a few hours before the demo

One of the coolest things about Sports Hackday was  that data providers like Sports Data LLC and platform companies like Google, Cloudant, Twilio etc., provided tools that ensured that we spent most of our time implement our idea and not worry about basic infrastructure and plumbing.

We used the Sports Data LLC‘s API to extract the injury information of English Premier League and broke them down based on teams, types of injuries, # of games missed due to these injuries. We built a fully working model of our idea using real data. It helped that we had an awesome team and that we did a very good job of decoupling the Frontend UI pieces and the backend database work which enabled us to work almost parallely. We had our hairy moments during the integration phase with the clock winding down to Noon, Sunday (the deadline for code-complete). However we were able get done most of what we wanted to do.

We did this cool  interactive visualization illustrating the breakdown of injuries in a team by category and the players. The thickness of the arcs depict the # of games they missed due to a particular injury.

We had 3 minutes to demo and it went well, although all of us were a bit nervous and very tired. We won two prizes. “Best data visualization” and the “Best overall data hack of the Hackday”.

Here is a piece on the Sports Hackday on Geekwire.
Local TV King 5‘s coverage of the event

Frankly, I did not expect to win the overall prize. We ended the evening very happy and very very tired.

Visuals

Manchester United had the highest # of player-games missed due to injuries so far this season. The 2nd visual highlights that muscle injuries is a team-wide issues and not just Nani who missed the most time due to muscle injuries.

This poses a new question : Is there something in the training regimen of Manchester United that is causing this? 

Manu Injury Breakdown

manu2

PS: I couldnt get the interactive part working on the blog due to javascript issues, if I ever figure it out, I will update.

MCFC Analytics blogposts – Summary #8


Here is the list of interesting posts I found in the past week

  1. An interesting post on home advantage and how it manifests itself into football stats by @FbPerspectives. The post also has a link to a detailed paper from 2009 on home advantage.
  2. Guardian Data blog has an interactive visualization of the Bolton – City game by @jburnmurdoch. The viz has a pitch map + a radial diagram that captures the pass direction and length.
  3. The man in the yellow shirt – an analysis of the refs by @PedroAfonso85
  4. An interactive visualization of the direction of a player’s passes by @alekseynp . Some of the outliers are very interesting.
  5. Momentum in Bolton – City game. by @SoccerStatistic . This is a different approach from the previous attempts on visualizing momentum using this data set.

I did not publish anything last week, although I did start writing. Hopefully I will publish something later this week.

Previous Summaries

Summary #7

Summary #6

Summary #5

Summary #4

Summary #3

Summary #2

Summary #1

If I missed any, please post them in the comments section or tweet them to me!

MCFC Analytics – Summary of blog posts #4


It has been about a month since the basic MCFC data set has been released and it is great to see lots of people churning out stuff using both the basic and advanced data sets.

Based on the tweets with #MCFCAnalytics tag, there are quite a few peoples’ projects are in progress. Good luck to all of you. Make sure you share your project/blog links with the hashtag.

Some people are looking for partners and contributors to the projects they are working on. If you are interested, please keep a tab on the #MCFCAnalytics tab and get in touch with folks directly.

Analysis posts

  1. @MarkTaylor0Analyzing the passes by comparing them to their expected pass completion rates using passes of James Milner in Bolton Vs. Manchester City from 2011-12 season.
  2. Mark also has post on how Man City and Bolton passed the ball
  3. @JdewittHow goals are scored in EPL
  4.  @ChrisJLilleyAnalyzing center-backs of the premier league
  5. @analysefooty (this blog!)Opposition analysis of Arsenal

Visualization posts

  1. @DanJHarrington – a very interesting visualizations of passes using Vector diagrams in Tableau Public
  2. @MarchiMax – a visualization of where the ball is a few seconds before a shot is taken
  3. @OngoalsscoredVisualization of the goalscorer’s body parts. Very neat!

If I missed any please post your links in the comments section.

Links to previous summaries

Summary #1

Summary #2

Summary #3

Feel free to tweet me or email me if you want to chat with me on something specific!

MCFC Analytics – Summary of blog posts # 3


Thanks for the amazing response to Summary of blog posts #1 & Summary of blog posts #2

I also want to thank people who have reached out to me via twitter with links to their blogs & posts.

Goalscorer ‘footedness’ by @DavidAHopkins measures the footedness or the foot favoured by Premier League goalscorers.

How do the more successful clubs keep the ball in EPL by @JDewitt talks about how the top teams in EPL keep possession. Also by John is Successful Passing and Winning

A sneak peek of a very interesting carto by @Kennethfield  Charlie Adam’s “passing wheel”

Football Philosophy – Long passes by @Poolq1984 explores the importance of long ball in football.

@We_R_PL has a nice post on how to use the MCFC dataset more efficiently. He also has spreadsheet which has the own goals calculated per team.

@footballfactman has a post on Darron Gibson using a mix of data from MCFC dataset, whoscored and statszone

The always excellent MarkTaylor0 has detailed post Analysing the quality of shots in Bolton – Manchester City game using the advanced dataset.

@ChrisJLilley has 3 posts on his blog using MCFC data

GK positional analysis

Premier league game changers Part I & Part II

@DanJHarrington has cranked up a lot of things using the advanced dataset

1.  an interactive tableau viz to see touches of each player in Bolton -City on the pitch.

2. Passing visualization using D3.js

3. Dan also has some interesting visualization work in progress. There is a cool video in the link showing ball movement.

Network passing diagrams by @DevinPleuler

Bolton – http://t.co/mcRQ0oHU

Man City – http://t.co/6mtGgJQS

Extracting data from XML

There have been some questions regarding this and some folks have come up with solutions

1. If you have MS Excel 2007 or a later version you can open the file in XML. The only issue with is that XML’s are nested and Excel converts this into a very flat format. So you will see multiple rows for the same events. For example: A successful pass has multiple rows indicating the direction, the x,y coordinates of where it is passed to. Read the data spec thoroughly to understand how the data is formatted in the XML. It will help understand the data much better.

2. Code for R users to extract the F-24 XML by @MarchiMax

3. Code snippets from @JBrisson to extract events from the F-24 XML

4. If you are into programming, most languages have XML parsers. A simple search will get you code snippets to start with.
If I missed any links, please let me know via Twitter or comment on the blog post. Always use #MCFCAnalytics tag in twitter so I can pick them up easily!

Visualizing momentum shifts in Bolton vs. Man City


This is an attempt to visualize the momentum shifts in Bolton vs. City with goals scored and substitutions using the #MCFC analytics advanced data tier – I.

I used possession as a proxy for momentum. The game is divided into 5 minute buckets. If a goal is scored in a bucket, the bucket will end at the minute of the goal scored.
E.g.: 0-4 is bucket #1. If a goal is scored in minute 7, then 5-6 is bucket #2. 7-11 is bucket #3 and so on.

Plots

Figure 1 – Overall cumulative possession difference vs. game time in minutes.

CumulativeAll

2. Figure 2 – Cumulative possession difference up until a goal is scored.
E.g.: Say 1-0 is scored in minute 27 and 2-0 is scored in minute 38. The cumulative possession difference is calculated from minute #1 through 27. After 1-0, cumulative possession difference is calculated from minute 28 onwards (the date of minute 1 through 27 is excluded).
This helps to see if there is any noticeable shift in the momentum of the game after a goal.

CumulativeMomentumShifts

Findings

  • Overall City has dominated possession. The cumulative possession delta was always negative (= in favor of City) in Figure 1.
  • When the cumulative possession difference was reset after each goal scored (Figure 2), we see that Bolton tried to take the initiative after City took the lead in Min 26. They really pushed hard after City scored the 0-2, pulling one back within 2 minutes of City’s 2nd goal.
  • Bolton continued to push for an equalizer until City scored the 1-3 right after the half-time.
  • Bolton enjoyed more possession as they searched for a goal and did a substitution at min 60 (an attacking midfielder for a holding midfielder) – it seems like the move paid off as they scored 2-3 in min 62.
  • Bolton continued to push for an equalizer. City subbed out Aguero for Tevez, both attacking players but Tevez is better at playing a deeper role and hold up the ball.
  • As the game progressed Bolton switched D.Pratley for Chris Eagles (probably a shift in attacking style) and City responded with a defensive move by subbing out Dzeko for Adam Johnson
  • Those two moves by City helped them restore control. Towards the end, City subbed out attacking midfielder David Silva for fullback Zabaleta, a defender to secure the result in the dying minutes.

This is a very quick and simple interpretation & visualization of the moment shifts. All feedback is welcome.

MCFC Analytics – summary of blog posts # 1


Here are some of analysis pieces based on the #MCFCAnalytics data published in the past couple of weeks. I plan to do a weekly post linking to all the articles I come across on Twitter.

My objectives for the weekly post are:

  1. Capture all the work done using the MCFC data set
  2. Provide a forum of discussion – you are welcome to use the comments section of this blog to discuss these posts.
  3. Get to know more people working on the data set and learn from the knowledge and ideas of others.

@MarkTaylor0 goes in-depth into the short passing ability of the keeper . Data shows that keepers had the best average short pass completion rate in the 2011-12 EPL season. However, that stat is not telling the full story.

Mark also has another interesting post on how Stoke City commit more fouls than Arsenal but end the season with the same # of yellow cards

Looks like Mark is working on more posts. I will check back next week to see what is new on Mark’s blog.

@MarchiMax  has a couple of posts

Passing in EPL post looks of the delta between the average pass attempts of a team and the average pass attempts they allow their opponents. Some of the outliers like Fulham, Newcastle and Swansea are interesting.

The Passing efficiency is more interesting. It looks at the passing completion % of all the teams and attempts to identify factors that affect the passing completion %. Factors like opponent, stadium as well as the zone of the pitch in which the pass is completed.

@Philby1976 has interactive dashboard of the whole data set. This is a great tool to visualize different metrics and data points. The site’s response time might vary based on the speed of your internet and the browser you are using.

Data viz and tableau expert @acotgreave has couple of early examples of what can be done with the data set using Tableau Public. There are 3 different examples  A) # of players used by the teams  B) How did the players of two teams fare against each in the previous meetings and C) Comparing  two strikers . The post not only highlights the data set but also the different visualizations you can do using  Tableau Public.

@DanJHarrington has another great on visualization using Tableau  – How does a team pass the ball . The post visualizes how each player in a team passes the ball (# of forward, backward & sideways passes). There is another post from the same website on  who should have been England’s # 1 GK at the Euros using the MCFC data.

@JimmyCoverdale  has a post on how data gives enough evidence on Why Walcott should be moved to a central midfield role

Apart from these I have a couple of posts on this blogs so far. Correlation between goals scored and pass completions in the final third and an opposition analysis of QPR. 

If I missed any, please add them in the comments section, I will cover them in my next weekly post.