Sports Hack Day Project


I have been busy ever since I started working for the Seattle Sounders about a month ago. It has been great so far. We are less than a month away from the season kick-off. I am very excited, to say the least.

Coming up in a few weeks is the Sloan Sports Analytics Conference in Boston. Last years conference had a profound impact on me. More about that in another post.

This weekend I participated in the 1st ever Sports Hackday in Seattle. The idea of learning something new, meet like-minded people and a chance to avoid the endless Superbowl pregame show were enough motivation to sign-up. The Hackday was very well-organized. Kudos to the organizers and sponsors. We started off Friday night with introductions and forming teams. Our team “Submarino” constituted of Sarah, AdamMatt and I. We had a few ideas going into the Hackday. After a brief brainstorm we decided on looking at the impact of injuries to soccer clubs.

Sunday morning during the integration phase a few hours before the demo

Sunday morning during the integration phase a few hours before the demo

One of the coolest things about Sports Hackday was  that data providers like Sports Data LLC and platform companies like Google, Cloudant, Twilio etc., provided tools that ensured that we spent most of our time implement our idea and not worry about basic infrastructure and plumbing.

We used the Sports Data LLC‘s API to extract the injury information of English Premier League and broke them down based on teams, types of injuries, # of games missed due to these injuries. We built a fully working model of our idea using real data. It helped that we had an awesome team and that we did a very good job of decoupling the Frontend UI pieces and the backend database work which enabled us to work almost parallely. We had our hairy moments during the integration phase with the clock winding down to Noon, Sunday (the deadline for code-complete). However we were able get done most of what we wanted to do.

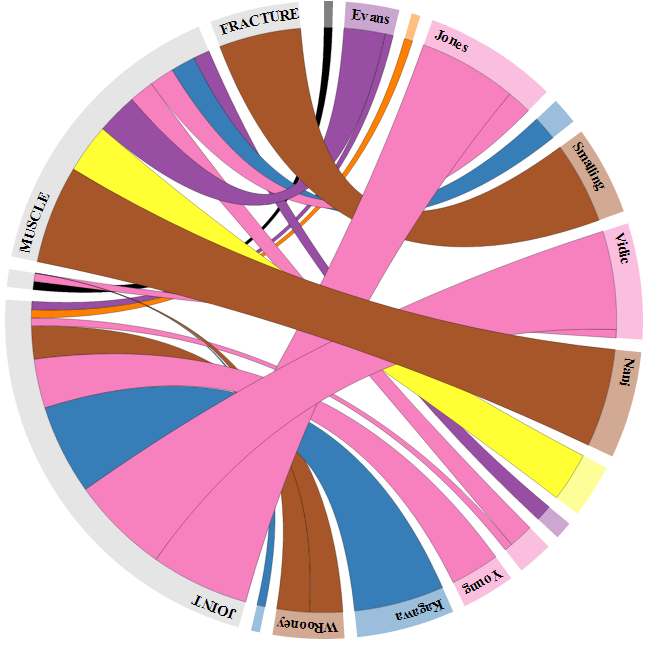
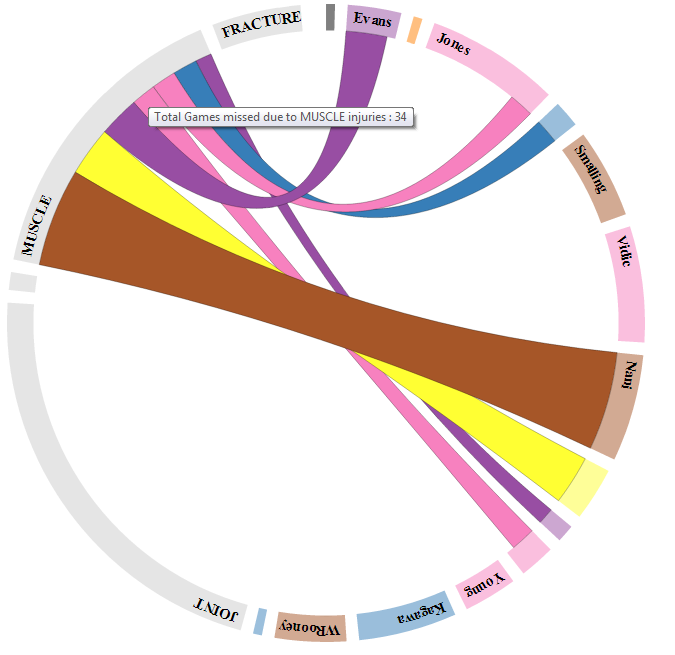
We did this cool  interactive visualization illustrating the breakdown of injuries in a team by category and the players. The thickness of the arcs depict the # of games they missed due to a particular injury.

We had 3 minutes to demo and it went well, although all of us were a bit nervous and very tired. We won two prizes. “Best data visualization” and the “Best overall data hack of the Hackday”.

Here is a piece on the Sports Hackday on Geekwire.
Local TV King 5‘s coverage of the event

Frankly, I did not expect to win the overall prize. We ended the evening very happy and very very tired.

Visuals

Manchester United had the highest # of player-games missed due to injuries so far this season. The 2nd visual highlights that muscle injuries is a team-wide issues and not just Nani who missed the most time due to muscle injuries.

This poses a new question : Is there something in the training regimen of Manchester United that is causing this? 

Manu Injury Breakdown

manu2

PS: I couldnt get the interactive part working on the blog due to javascript issues, if I ever figure it out, I will update.

MCFC Analytics-Summary of blogposts #6


This week I saw a few more new bloggers getting into the act with the data.

First up, there was this article by @RWhittall of TheScore.com where Richard talked about “soccer data abuse by some bloggers using the MCFC data”. The gist of the article is that some of the bloggers are extrapolating too much with their conclusions based on one year’s worth of data from one league. The other point made in the article is that the output of the majority of  the work in soccer analytics isn’t groundbreaking and it is just adding a data context to what we already knew.

While I see where Richard is coming from, I don’t quite agree either with his assessment of the state of soccer analytics or the “data abuse” bit.

Unquestionably, we haven’t even scratched the surface of what we can do with data in soccer. The majority of the research work in the soccer analytics is carried out in the private domain.  That is because soccer data is not a commodity like it is in other sports like Baseball. The MCFC & Opta project could be a significant step in the direction of making soccer data more accessible to a wider audience,  if it can get enough passionate people interested in the project. However, like in any type of writing in the public domain, there is the good and the not so good. One of the things we discussed with Gavin Fleig, Head of Performance Analysis at Manchester City, Simon Farrant, Marketing coordinator at Opta et al is to build a community that fosters communication, collaboration and open feedback among the members and the readers. This should help everyone get better in some time.

Without further ado, here are links to some interesting work I found in this past week.

@MarkTaylor0 has a comprehensive piece on the state of soccer analytics and where it stands vis-à-vis other sports like NFL and Baseball. – The case for data analysis in football. This is a must read.

Analytics posts

  1. @PedroAfonso85 has a couple posts using the advanced data set
  2. @ChrisJLilley continues with his positional analysis series with Strikers and Central attacking midfielders
  3. @FootballFactman ‘s piece talks about what to look for in goalkeepers of the premier league
  4. @shots_on_target talks about the correlation between points in fantasy football and attacking stats
  5. In my weekly opposition analysis series I analyzed at Sunderland using last season’s data.

Visualization posts

  1. Earlier today I saw Voetstat, a neat blog by @Voetstat_craig which has some visualizations of pass completion + heatmaps. There are multiple posts. I haven’t had a chance to read all of them yet.
  2. @TomBerthon has this visualization of how goals were scored in the Bolton – City game from last season

If I missed any links, post them in the comments section and tweet them with the hashtag #MCFCAnalytics. I will retweet them.

Previous Summaries

Summary #5

Summary #4

Summary #3

Summary #2

Summary #1