
I have been busy ever since I started working for the Seattle Sounders about a month ago. It has been great so far. We are less than a month away from the season kick-off. I am very excited, to say the least.
Coming up in a few weeks is the Sloan Sports Analytics Conference in Boston. Last years conference had a profound impact on me. More about that in another post.
This weekend I participated in the 1st ever Sports Hackday in Seattle. The idea of learning something new, meet like-minded people and a chance to avoid the endless Superbowl pregame show were enough motivation to sign-up. The Hackday was very well-organized. Kudos to the organizers and sponsors. We started off Friday night with introductions and forming teams. Our team “Submarino” constituted of Sarah, Adam, Matt and I. We had a few ideas going into the Hackday. After a brief brainstorm we decided on looking at the impact of injuries to soccer clubs.

Sunday morning during the integration phase a few hours before the demo
One of the coolest things about Sports Hackday was that data providers like Sports Data LLC and platform companies like Google, Cloudant, Twilio etc., provided tools that ensured that we spent most of our time implement our idea and not worry about basic infrastructure and plumbing.
We used the Sports Data LLC‘s API to extract the injury information of English Premier League and broke them down based on teams, types of injuries, # of games missed due to these injuries. We built a fully working model of our idea using real data. It helped that we had an awesome team and that we did a very good job of decoupling the Frontend UI pieces and the backend database work which enabled us to work almost parallely. We had our hairy moments during the integration phase with the clock winding down to Noon, Sunday (the deadline for code-complete). However we were able get done most of what we wanted to do.
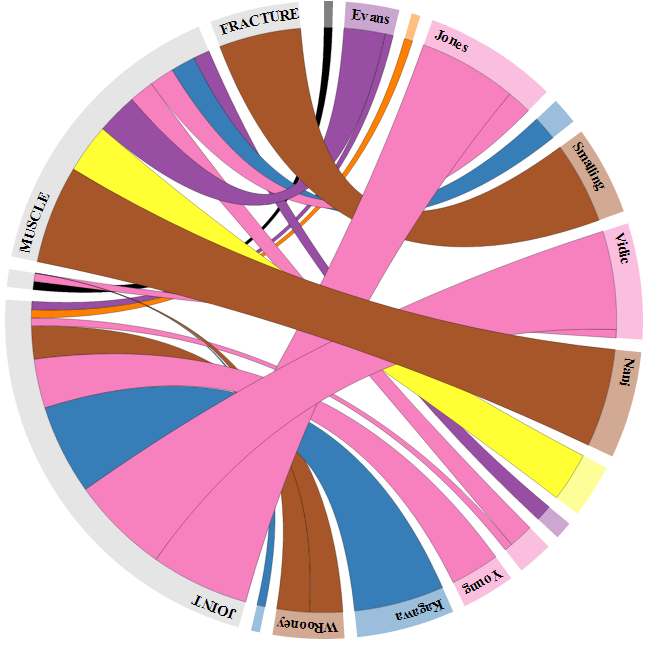
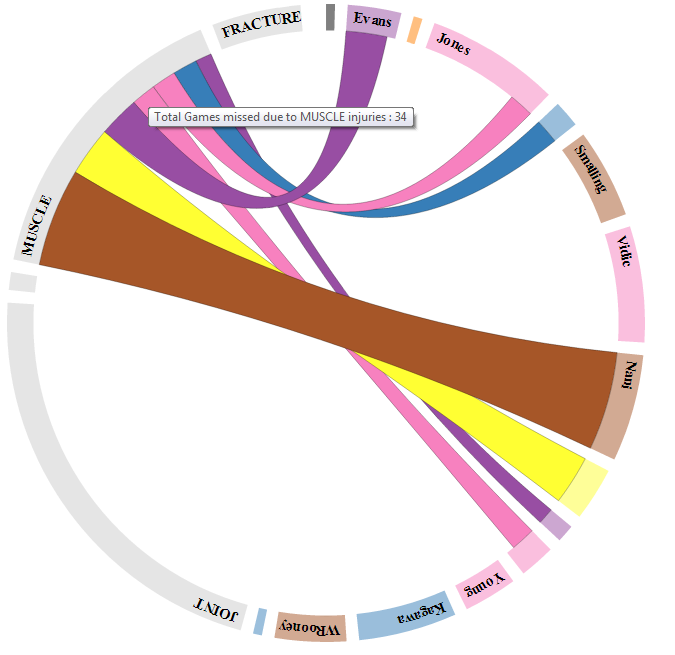
We did this cool interactive visualization illustrating the breakdown of injuries in a team by category and the players. The thickness of the arcs depict the # of games they missed due to a particular injury.
We had 3 minutes to demo and it went well, although all of us were a bit nervous and very tired. We won two prizes. “Best data visualization” and the “Best overall data hack of the Hackday”.
Here is a piece on the Sports Hackday on Geekwire.
Local TV King 5‘s coverage of the event
Frankly, I did not expect to win the overall prize. We ended the evening very happy and very very tired.
Visuals
Manchester United had the highest # of player-games missed due to injuries so far this season. The 2nd visual highlights that muscle injuries is a team-wide issues and not just Nani who missed the most time due to muscle injuries.
This poses a new question : Is there something in the training regimen of Manchester United that is causing this?
PS: I couldnt get the interactive part working on the blog due to javascript issues, if I ever figure it out, I will update.

Paul Clarke
/ February 9, 2013Ref. Man Utd. Nice piece. Probably need to look at the injuries in the context of what they look to achieve in training. Would be good to know the data on the actual times of injuries i.e. how deep into session or game they happen. My sense is that because United train to be ready for a hectic last ten minutes of the match that they may pick up injuries towards the end of training as the intensity goes up to mimic the demands of coming behind in a competitive match i.e. tired bodies going through intense work. Whilst this approach may yield a higher injury level the methods are endorsed by the amount of games they win late and their success over the long-term. Another key factor is the mental conditioning this achieves…both for United players knowing they can come back in any match and on opposition players defending a one-goal lead going into the last ten minutes of a match
Ravi Ramineni
/ February 9, 2013Hi Paul
Yes, the data we used had 49 diff types of injuries. We classified them broadly into muscle, joint, fracture, ligament & misc (virus, flu etc..). You are correct about the need for more granular breakdown and data on trainings to dig deeper.
The thing is you can prevent most (if not all) of the muscle injuries if you measure how fatigued a player is. Of course, that level of data will never be made public.
Thanks for reading and the comment.
James
/ March 19, 2013Ravi visuals look good, I work in injury analytics with some medical colleagues we have developed an analytics and medical record system for soccer. http://Www.benchmark54.com there is a little info there. We are working with a large academic research institute in Sweden and have just been invited to Brazil to work with them on audit and analytics in soccer there. We do also look after some of the EPL. We would be interested in discussing data mining and creation of meaningful graphical representation of the data so that users ie physios drs and coaches “get it” without having to be statisticians themselves. I’m Dr James Brown
Ravi Ramineni
/ March 19, 2013Thanks for the comment, James. I will get in touch with you via email.
sporsts
/ March 26, 2013that project is very essencial for all.i learn many things from it.
sports
/ March 26, 2013United is popular every man. when I watch this tem i proud
Steven Souter
/ July 21, 2014Hi
How did u extract data from Sports data LLC? I am looking at whether ethnicity is a risk factor for increased injury rates.
Please help me. I have a 90 day trial with sports data LLC but cant get past xml files as im useless with computers.
Ravi Ramineni
/ August 4, 2014Hi Steve
You have to parse the api response xml. Google Xml parsing, you should find a lot of code samples and how-tos. You could also try open the xml from excel. From excel 2010 onwards they support xml i believe. It wont parse it perfectly but will get you much further.
Cheers
Ravi