Soccer Analytics Panel – MIT Sloan Sports Analytics Conference 2015 #SSAC15


I havent posted anything on this blog in more than 2 years. Life has been hectic both professionally and personally ever since I took the Sounders job.

In February I was invited to be on the Soccer panel at the MIT Sloan Sports Analytics Conference #SSAC15. It was a great experience to be a part of the panel. Not only that it is a recognition of some of the work we have been doing at the Seattle Sounders but also because attending this conference in 2012 (thanks to @onfooty for encouraging me to go) was one of the origins and catalysts of my career switch. This back-story made it even more special to be on the #SSAC15 soccer panel.

SSAC have uploaded the video of the panel. Posting the video to this blog represents a small “coming full-circle” moment for this blog and for me personally.

I hope you enjoy it and looking forward to hear your thoughts and feedback.

Details of the panel and members 

Watch the full video of the panel

MIT Sloan Sports Analytics Conference 2013: Soccer Analytics Panel


Panelists : Chris Anderson, Albert Larcada, Blake Wooster, Jeff Agoos

The makeup of this year’s panel is very different from that of Soccer Panel at SSAC 2012. Dominated by “club insiders” last year, this year’s panel had a mix of “outsiders” like Chris Anderson, Blake Wooster from Prozone represented the data companies, Albert Larcada from ESPN coming from media and Jeff Agoos, a former player and Technical Director of MLS.

The Ballroom was almost full and this was a bigger ballroom than that of the last year’s conference. (My totally un-scientific method of measuring crowd sizes puts “almost full” > “75% full of last year”)

Marc Stein moderated the panel as was the case last year.

soccerpanel

This year’s panel took a completely different track compared to the panel from last year. Last year it surrounded around how analytics is used, where it is useful and the importance of context and trust. The biggest challenge cited in 2012 was the availability of good data to work with.  This year it centered more around how much analytics is used by managers, metrics, visualizations – use of analytics in the media and trust (a repeat theme from year).

The panel started off with a historic perspective of soccer analytics from Chris. I thought it was a very good beginning that gave the audience an idea of how far we have come. Albert’s examples of using heatmaps of Messi and Ronaldo in the build-up to the “Clasico” in SportsCenter showed how data is being used to tell a story. The challenge in a scenario like SportsCenter is that the announcers need to be able to explain the graphic and tell the story in less than 10 seconds. Choosing the right type of visualization is key. I also liked the idea of “visualization is analytics” quote from Albert. All visualizations are an approximation of the raw data. If done right, they can tell a story not just in media but also inside a soccer club.

The big questions

  1. How much analytics is being used by the club managers?
  2. What are the challenges in making the coaches use analytics?
  3. Metrics – what do we have today?

How much analytics is being used by the club managers?

Chris tried to answered this based on his experience working with clubs as a consultant but the viewpoint of an “insider” (like an analyst at a club) citing examples where analytics has been used by a manager successfully would have been a good counter-balance.  It is always tough balancing act to not reveal confidential details and have a frank discussion but I felt that the club angle was addressed better in last year’s panel. West Ham United’s manager Sam Allardyce talking about how he uses analytics is a good example.

What are the challenges in making the coaches use analytics?

There was some great discussion on this one.  Coaches have a lot at stake and they may not be willing to use something new unless they know (with a high degree of confidence) or trust that it will help them but they won’t know for sure if it will be useful unless hey use it. The classic chicken and egg. A great example was the importance of survival in a promotion-relegation environment and how that pushes managers and front-offices more towards short-term thinking and immediate results.

Daryl Moorey, the GM of Houston Rockets and a co-chair of the SSAC brought up a great point in the “Revenge of the Nerds” panel about how the front office needs to support and persist with analytics. Managers may not trust it right away but if they find it useful over a period of time they will eventually come around.

Blake had a point when he stressed that the onus is on the analyst to communicate the value of analytics to the coach. If the coach doesn’t see value in it, it is probably because the analyst didn’t do a good enough job of conveying the message.

In the talk “Why we don’t understand Luck” by Michael Mauboussin one of my favorite talks of the conference, Michael stressed the importance of evaluating things based on the process (which is very hard to do) rather than the outcomes (which is easy and what we do normally).

I believe that analytics is being used differently in different clubs (hardly surprising). It has a complimentary role as “another tool” in the overall toolkit for success.  The two key themes that resonated across the 2-day conference “communicating the message” and “winning the trust of coaches/decision-makers” are very important.

Metrics – what do we have today?

This is probably one of the most debated aspect of soccer analytics today. What metrics do we have? What is the equivalent of Baseball’s WAR in soccer? There is a lot to gain from knowing the process of how analytics and metrics work in other sports but every sport is unique and presents its own challenges. It is a fact that we haven’t been able to model soccer matches as well we would love to. Albert brought up a great point about how the paucity of scoring on soccer makes it much harder to model than almost every other team sport. We haven’t yet come up with a formula that tell us how to win a game or score a goal. That is because there are many ways to win a soccer game. Different coaches employ different systems. A metric/KPI valued highly in one system might not matter at all in another system. For example, speed on the ball and accurate long-balls might be very important in a counter-attacking system but may not be that important in a short passing system.


Charles Reep, probably the first soccer analyst, concluded that most goals were scored from fewer than three passes: therefore he concluded it was important to get the ball quickly forward as soon as possible.

While his statement might still hold true, the “How?” is the key question. The answer is not as straightforward. The quickest way to move the ball is for the goalkeeper to hoof balls upfield and we know that it doesn’t work most of the time.

I believe the availability of spatial XY-data + data from camera tracking systems (installed in most of the stadiums around the world today) in conjunction with video has helped in answering the “How” better. But we still have a long way to go.

As Chris pointed out at the very beginning of the panel – This is not a revolution but an evolution. We are constantly evolving.

A few more of my thoughts in a podcast with Richard Whittall  editor of the The Score Media’s Counter Attack blog

Suggestions for the next year’s panel

  1. I felt that the composition of the 2012 and 2013 panels were at the extremes in terms of “club insiders/outsiders”. A panel with a mix of the two groups would probably be more useful.
  2. Panel formats don’t lend themselves very well to 1-on-1 dialogue and interaction. An online Q & A chat session with the panelists during the conference is a good thing to try. I got similar feedback from a few others who attended the conference.
  3. Have Big Sam on the panel! – Seriously, having a manager who has used analytics and is willing to talk about it would elevate this panel to a whole another level. I am aware that EPL will be in season, but technology gives the option to have someone participate remotely.

I have another post summarizing my views on the other panels I attended coming up in a few days.

Links

Official website Sloan Sports Analytics Conference

Richard Whittall’s thoughts on the Soccer panel

Zach Slaton’s Summary of the SSAC 13

Mitch Lasky’s impressions of the conference

Sports Hack Day Project


I have been busy ever since I started working for the Seattle Sounders about a month ago. It has been great so far. We are less than a month away from the season kick-off. I am very excited, to say the least.

Coming up in a few weeks is the Sloan Sports Analytics Conference in Boston. Last years conference had a profound impact on me. More about that in another post.

This weekend I participated in the 1st ever Sports Hackday in Seattle. The idea of learning something new, meet like-minded people and a chance to avoid the endless Superbowl pregame show were enough motivation to sign-up. The Hackday was very well-organized. Kudos to the organizers and sponsors. We started off Friday night with introductions and forming teams. Our team “Submarino” constituted of Sarah, AdamMatt and I. We had a few ideas going into the Hackday. After a brief brainstorm we decided on looking at the impact of injuries to soccer clubs.

Sunday morning during the integration phase a few hours before the demo

Sunday morning during the integration phase a few hours before the demo

One of the coolest things about Sports Hackday was  that data providers like Sports Data LLC and platform companies like Google, Cloudant, Twilio etc., provided tools that ensured that we spent most of our time implement our idea and not worry about basic infrastructure and plumbing.

We used the Sports Data LLC‘s API to extract the injury information of English Premier League and broke them down based on teams, types of injuries, # of games missed due to these injuries. We built a fully working model of our idea using real data. It helped that we had an awesome team and that we did a very good job of decoupling the Frontend UI pieces and the backend database work which enabled us to work almost parallely. We had our hairy moments during the integration phase with the clock winding down to Noon, Sunday (the deadline for code-complete). However we were able get done most of what we wanted to do.

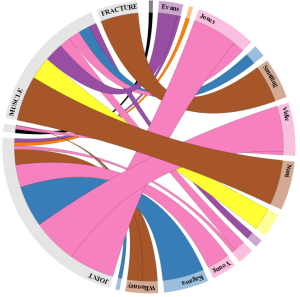
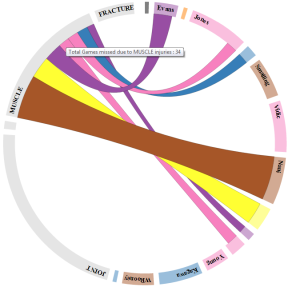
We did this cool  interactive visualization illustrating the breakdown of injuries in a team by category and the players. The thickness of the arcs depict the # of games they missed due to a particular injury.

We had 3 minutes to demo and it went well, although all of us were a bit nervous and very tired. We won two prizes. “Best data visualization” and the “Best overall data hack of the Hackday”.

Here is a piece on the Sports Hackday on Geekwire.
Local TV King 5‘s coverage of the event

Frankly, I did not expect to win the overall prize. We ended the evening very happy and very very tired.

Visuals

Manchester United had the highest # of player-games missed due to injuries so far this season. The 2nd visual highlights that muscle injuries is a team-wide issues and not just Nani who missed the most time due to muscle injuries.

This poses a new question : Is there something in the training regimen of Manchester United that is causing this? 

Manu Injury Breakdown

manu2

PS: I couldnt get the interactive part working on the blog due to javascript issues, if I ever figure it out, I will update.

Modeling 101


“Essentially, all models are wrong, but some are useful.” – George E.P. Box

from Empirical Model-Building and Response Surfaces (1987) co-authored with Norman R. Draper, p. 424.

Mr. Box’s quote is quite popular and used a lot these days. However, I am not sure if all those who quote it fully understand it. And that includes me.

What I took away from the quote.

A model is an approximation of a process that we don’t fully understand. We model processes to get a deeper understanding of the process itself. To build a model we use what we understand about a process and try to approximate (or sometimes ignore) what we dont know.

All models are wrong because of the inherent approximation. But some could be useful because what we have “approximated (or ignored)” is not important to understand or replicate the process.

“Relative simplicity” is an important virtue of a good model. By “relative simplicity” I mean the simplicity of a model compared to the actual process. For example, a “simple model” of Relativity theory for a physicist could still take me two lifetimes to understand.

Math lends itself very well to represent these models. We test the usefulness of a model against the real process by giving identical inputs and comparing the outputs. This is easy in case of some models and not so easy in case of others. ( like verifying the existence of Higgs-Boson particle using the Large Hadron Collider that cost an estimated $9b to build).

A model is useful if for a range of inputs, the output of model closely matches the real output of the process. (How close? – It is a matter of threshold and the +/- error range the user of the model is comfortable with.). To summarize, an useful model has some predictive power with

The game of football is a process. Over the years a lot of people have tried to improve our understanding of the game by building models based on what they understood with the data available to them. We have been collecting more and more information as we progressed. More information has led to the better understanding of the game and dispelling some of the myths. But it has also helped create “new myths” (or truths until they get proven wrong in due course of time).

There are a lot of models out there for football. Some based on past results, some based on what happens in a game (events like shots, goals, final 3rd passes etc) and so forth. I dont quite agree with all of them. Some I agree with more than the others.

What I look for in a model?

  1. A model should an understanding of the process; to be aware of what and how the process works. It doesn’t have to be comprehensive (because it is a model after all) but capture the essence of it.Example: If I want to build a model to predict the winner of a football game – I want my model to take into consideration how I win a game of football? By scoring more goals than the opponent. How do I score more goals? By taking a lot of (hopefully good) shots and not letting the opponent take good shots, How have the two teams have been doing in the run-up to the game and so forth. I can list 20-30 items and I am sure I still would have missed many things. The goal is to not to account for every factor but to identify the handful of factors that capture the essence or “signal” as Nate Silver calls it in his popular new book.

    I am skeptical of any model that does not understand the process that it is trying to be a model of.

  2. A model should factor in the nature of the underlying data from a process. For example: Based on Chris Anderson‘s analysis, number of goals scored in a game is not normally distributed. Something like that needs to be factored in if the model using goals scored as an input. This is probably more important for models making long term predictions because the inherent characteristics of data tend to manifest over a longer period of time than in a shorter period of time.Example: Probability of a getting 4 heads if you toss a coin 4 times is 6.25%. But if you repeat the experiment 5 times, you might get 4 heads once, twice, thrice, 4 times, 5 times or never. You might have to repeat the experiment thousands of times to see the probability of 4 heads converge to 6.25%.

Building a good model is not trivial and is an iterative process. But if the first version of a model doesn’t address the above, it might be time for a rethink.

MLS Playoffs: Does something need fixing?


Seattle Sounders were eliminated from the MLS playoffs on Sunday night. I have seen a lot of discussion about MLS playoff format and its drawbacks in the past few weeks and more of it now that two lower seeds have made it to the MLS Cup final.
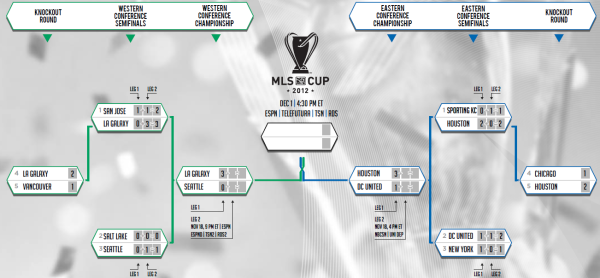
Photo: MLS Playoff Bracket from mlssoccer.com

Both 1st seeds, San Jose Earthquakes (Western Conference) and Sporting Kansas City (Eastern Conference) got eliminated in the conference semifinals by lower seeds LA Galaxy (4th seed) and Houston Dynamo (5th seed) respectively. LA eliminated Seattle (3rd seed) and Houston eliminated DC United (2nd seed) in the conference finals to reach the MLS Cup final.

The recurring themes in these discussions are the following:

  • Is the MLS playoff format penalizing the top seeds by not giving enough weight to the regular season?
  • Is the winner of MLS Playoffs the “best team” in MLS?
  • Can MLS “improve” the playoff format?

This post is a summary of my thoughts on the subject.

Over the years, MLS has tried various playoff formats to give an advantage to the higher seeds:

  • Best-of-3 series (higher seed gets to play 2 games at home)
  • 2-leg home & home series (higher seed plays the 2nd leg at home) and
  • A single elimination game (played at the home of the higher seed)

However, since 2001 only 4 of 12 MLS Cup winners are 1st seeds and two 1st seeds played against each other in the final only twice.

% of Cup winners that were 1st seeds 33.3%
% of Cup runners-up that were 1st seeds 33.3%
% of Finals that featured at least one 1st seed 50%
% of Finals that featured both 1st seeds 16.7%

The “best team”, in conventional terms is the team with the best record at the end of the regular season. In most leagues around the world, the team with the best record at the end of the season is the “Champion”. In MLS, in 8 out of 12 seasons, the “best team” did not win the MLS Cup.

How does MLS playoffs compare to other sports in the US?

I compared MLS with NFL, NBA and MLB playoff winners since 2000-01 (12 seasons)

MLS NFL NBA MLB
% of Cup winners that were 1st seeds 33.3% 16.7% 33.3% 25%
% of Cup runners-up that were 1st seeds 33.3% 75% 25% 16.7%
% of Finals that featured at least one 1st seed 50% 66.7% 50% 41.7%
% of Finals that featured both 1st seeds 16.7% 8.3% 8.3% 0%


Success for 1st seeds in MLS is very similar to that of others leagues. If anything, 1st seeds do marginally better in winning MLS playoffs than in other leagues.

To summarize:

  • Playoffs tend to level the field. The possible impact of minor injuries, luck and random on-field events increases manifold.

This implies that all the playoff teams start with a good chance (if not equal) of winning the playoffs. Regular season record is important to make sure a team qualifies for the playoffs. Once a team is in the playoffs, regular season record does not mean much.

  • The sudden-death nature and the unpredictability of the playoffs generate excitement; keeps a larger segment of the fan base engaged in the sport for a longer period of time. It also tends to attract casual fans to follow the sport during the playoffs. This is reflected in the higher TV ratings of the playoffs compared to the regular season.

As a league in its early stages of growth, MLS would love to maximize the excitement to get more people spend more time watching/following their league. This would translate into increased TV ratings that will help MLS negotiate better TV deals further along the way.

Is the MLS playoff format penalizing the top seeds by not giving enough weight to the regular season?

No. The unpredictability we are seeing in MLS playoffs is an inherent characteristic of playoffs in general.

Can MLS improve the current playoff format?

It depends on the definition of “improvement”. If it means giving more chance of winning to the top seed, it would be at the expense of some of the excitement and unpredictability.

Example 1:- Limit the playoff teams to 8 (or 6). With an 8-team playoff format, Houston would not have made it this year, With a 6-team format, neither Houston nor LA would have made it.

Example 2:- If the aggregate is even after 2 legs, the higher seed advances. This is being used in Liga MX playoffs since 1996. However, only 6 1st seeds has won the “Liguilla” (Playoffs) since 2000 ( 6 in 34 – 17.6%). Please note that in México there are two half-seasons per year, each followed by a Liguilla.

Based on the league’s growth and economic implications, I highly doubt they will go the route of reducing playoff teams. Trying the Liga MX playoff system won’t harm but I am not very sure if it is going to make that much of a difference.

There are more ways the format can be tweaked than the two examples above. However, it might be very difficult to maximize excitement as well as give a higher chance of success for the higher seeds.

While MLS may not be able to do much with the playoff format given the constraints, they can definitely do a better job of scheduling the playoffs.

Seattle played RSL in Western Conference semi-finals on 11/2 (Home) and 11/8 (Away). They returned to Seattle late on 11/9 due to snow and flew to LA on 11/10 to play the WC final away leg vs. LA Galaxy on 11/11. They had a 1-week break for the return leg of the WC final in Seattle on 11/18.

It might have been much better for Seattle if they got a couple more days between the 2nd leg of the semifinal and the 1st leg of the instead of a minimum break with zero leeway for unforeseen circumstances. DC United faced the same problem due to rescheduling forced Hurricane Sandy.

Issues like these can be fixed easily and they should be.

Is the winner of the MLS cup the “best team” in MLS?

There is no precise answer to this question.

I believe that the team with the best regular season record is the best team. However, MLS teams do not play a balanced schedule. Teams play more games against in-conference opponents than teams outside their conference. This weakens the argument for the team with the best regular season record being crowned the best team. If MLS ever moves to a balanced schedule, I believe that the team with the best regular season record should get more recognition and credit.

With are without a balanced schedule, I believe that playoffs are here to stay.

The onus is upon the teams to figure out a way to peak during playoffs. After all, a seed is just a number; 5th or 1st does not seem to matter during the playoffs.

Will Johnson of Real Salt Lake summed up the playoffs very eloquently:

“It’s a bit of a crapshoot. It always has been over the years and it is what it is. It’s fun and we enjoy playing in these kind of games. There’s so much on the line and anyone can get the MLS Cup. Obviously we experienced that ourselves one year.” ( Source: Seattle Times)


I hope Sounders and Sounders’ fans can experience “that” feeling soon.


Related articles that I found interesting:

Does the best team win the “World Series”?

Effect of the length of the season in deciding the league champion

MCFC Analytics blogposts Summary #9


In the past week, I found the following posts written using the #MCFCAnalytics data

  1. Some interesting stuff by @PedroAfonso85 building on some previous work  to breakdown the importance of ball possession and some discussion about the oft discussed yet hard to quantify, momentum.
  2. @MarkTaylor0 analyzed Blocked shots to find if blocking shots is a talent.
  3. @hpstats visualized points difference “with/without” a player in  the starting lineup. Also from the same blog is profiling players based on their shooting
  4. @SportsViz has a video with examples of 3D-visualization of passes using the data from Bolton vs. City game

Previous Summaries

Summary #8

Summary #7

Summary #6

Summary #5

Summary #4

Summary #3

Summary #2

Summary #1

MCFC Analytics blogposts – Summary #8


Here is the list of interesting posts I found in the past week

  1. An interesting post on home advantage and how it manifests itself into football stats by @FbPerspectives. The post also has a link to a detailed paper from 2009 on home advantage.
  2. Guardian Data blog has an interactive visualization of the Bolton – City game by @jburnmurdoch. The viz has a pitch map + a radial diagram that captures the pass direction and length.
  3. The man in the yellow shirt – an analysis of the refs by @PedroAfonso85
  4. An interactive visualization of the direction of a player’s passes by @alekseynp . Some of the outliers are very interesting.
  5. Momentum in Bolton – City game. by @SoccerStatistic . This is a different approach from the previous attempts on visualizing momentum using this data set.

I did not publish anything last week, although I did start writing. Hopefully I will publish something later this week.

Previous Summaries

Summary #7

Summary #6

Summary #5

Summary #4

Summary #3

Summary #2

Summary #1

If I missed any, please post them in the comments section or tweet them to me!

MCFC Analytics – blogposts summary #7


I did not see too many new posts in the past week. I didn’t publish any as I was busy with a different project.

  1. An interactive viz of Bolton – Manchester City  match data by @JBurnMurdoch on @GuardianData blog
  2. @HPStats attempts at defining metrics to be able to cluster players based on their style. Here is a good first step on Passing
  3. @shots_on_target made a summary of vital stats regarding goals, shooting accuracy, penalties etc..
  4. Scouting report on Tim Howard by @footballfactman
  5. An interactive visualization of the full dataset by @PhilyB1976 I posted this in one of the first few summary posts but there is additional information on the site. worth revisiting!
  6. An

Previous Summaries

Summary #6

Summary #5

Summary #4

Summary #3

Summary #2

Summary #1

If I missed any, please post them in the comments section or tweet them to me!

MCFC Analytics-Summary of blogposts #6


This week I saw a few more new bloggers getting into the act with the data.

First up, there was this article by @RWhittall of TheScore.com where Richard talked about “soccer data abuse by some bloggers using the MCFC data”. The gist of the article is that some of the bloggers are extrapolating too much with their conclusions based on one year’s worth of data from one league. The other point made in the article is that the output of the majority of  the work in soccer analytics isn’t groundbreaking and it is just adding a data context to what we already knew.

While I see where Richard is coming from, I don’t quite agree either with his assessment of the state of soccer analytics or the “data abuse” bit.

Unquestionably, we haven’t even scratched the surface of what we can do with data in soccer. The majority of the research work in the soccer analytics is carried out in the private domain.  That is because soccer data is not a commodity like it is in other sports like Baseball. The MCFC & Opta project could be a significant step in the direction of making soccer data more accessible to a wider audience,  if it can get enough passionate people interested in the project. However, like in any type of writing in the public domain, there is the good and the not so good. One of the things we discussed with Gavin Fleig, Head of Performance Analysis at Manchester City, Simon Farrant, Marketing coordinator at Opta et al is to build a community that fosters communication, collaboration and open feedback among the members and the readers. This should help everyone get better in some time.

Without further ado, here are links to some interesting work I found in this past week.

@MarkTaylor0 has a comprehensive piece on the state of soccer analytics and where it stands vis-à-vis other sports like NFL and Baseball. – The case for data analysis in football. This is a must read.

Analytics posts

  1. @PedroAfonso85 has a couple posts using the advanced data set
  2. @ChrisJLilley continues with his positional analysis series with Strikers and Central attacking midfielders
  3. @FootballFactman ‘s piece talks about what to look for in goalkeepers of the premier league
  4. @shots_on_target talks about the correlation between points in fantasy football and attacking stats
  5. In my weekly opposition analysis series I analyzed at Sunderland using last season’s data.

Visualization posts

  1. Earlier today I saw Voetstat, a neat blog by @Voetstat_craig which has some visualizations of pass completion + heatmaps. There are multiple posts. I haven’t had a chance to read all of them yet.
  2. @TomBerthon has this visualization of how goals were scored in the Bolton – City game from last season

If I missed any links, post them in the comments section and tweet them with the hashtag #MCFCAnalytics. I will retweet them.

Previous Summaries

Summary #5

Summary #4

Summary #3

Summary #2

Summary #1

Sounders vs. Timbers – The Cascadia Cup Derby


Warning : No stats or data analysis in this post 🙂

In a weekend filled with great derbies and ‘super-clásicos’ I was lucky enough to watch the “Cascadia Derby”, live. I rarely missed a Sounders home game in the past year or so. This one was special, my first taste of Seattle – Portland. People often ask me what is the atmosphere like at a football game in the US and how does it compare to the best in Europe. I would say Seattle Sounders provide the best atmosphere in MLS with an average crowd of roughly 38000 per game (MLS average is closer to 20,000). And this game had by far the best atmosphere ever at the CenturyLink field.

Seattle Sounders vs. Portland Timbers.

The crowd

The 67K CenturyLink stadium was a sellout. It was a gorgeous and sunny day in Seattle

Official announced attendance : 66,452. And it was noisy. About 3K-4K Timbers fans made the ~200 mile trip up north to the Emerald City. Although these teams have joined the MLS recently, the rivalry is much older when the two clubs were in the lower divisions of US soccer.

Portland had nothing to play for except for the Cascadia Cup. Seattle had clinched a spot in the playoffs. However, they need points to get a better seeding in the playoffs. More on MLS Playoffs

The stadium started filling up around 5:30p. By 6p, it was almost full. Here are a couple of spectacular panorama shots taken by Sarah Rudd.

Pregame – CenturyLink Field

Sounders – Timbers – kick-off

The Tifo being unveiled by the supporter groups

The atmosphere was electric and buzzing (a lot more than usual). Former player and fan favorite Roger Levesque was felicitated in the pre-game. Later he sent the crowd berserk with his rousing introduction to the Sounders’ starting line-up.

The game

The game started at a very high pace with Portland pinning Seattle in its own half in the early minutes. However, Seattle took control of the game gradually and around the 25th minute they scored via an own goal. A few minutes later Eddie Johnson made it 2-0 finishing off a great through ball from Brad Evans. More of the same in the 2nd half with Freddy Montero making it 3-0. The quality of the football wasnt the greatest but rivalry & derby games are much more than that. ,

Highlights

It was an #epic result that takes the Sounders past LA Galaxy into 3rd place with a game in hand. Latest MLS standings

In terms of the Cascadia Cup, if  Vancouver Whitecaps get a result at home vs. Portland next week, Seattle would retain the Cup.