This is an attempt to visualize the momentum shifts in Bolton vs. City with goals scored and substitutions using the #MCFC analytics advanced data tier – I.
I used possession as a proxy for momentum. The game is divided into 5 minute buckets. If a goal is scored in a bucket, the bucket will end at the minute of the goal scored.
E.g.: 0-4 is bucket #1. If a goal is scored in minute 7, then 5-6 is bucket #2. 7-11 is bucket #3 and so on.
Plots
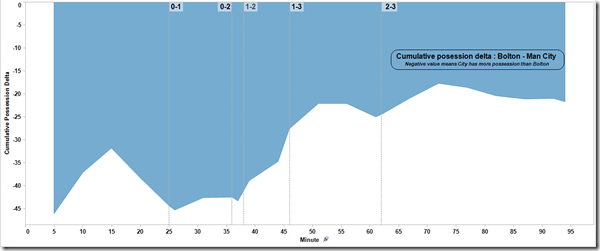
Figure 1 – Overall cumulative possession difference vs. game time in minutes.
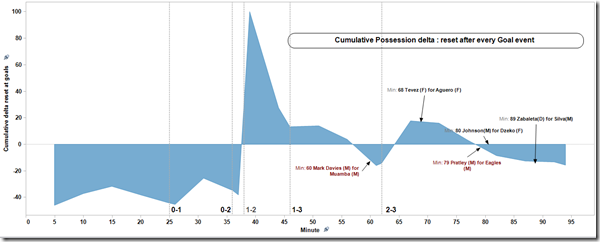
2. Figure 2 – Cumulative possession difference up until a goal is scored.
E.g.: Say 1-0 is scored in minute 27 and 2-0 is scored in minute 38. The cumulative possession difference is calculated from minute #1 through 27. After 1-0, cumulative possession difference is calculated from minute 28 onwards (the date of minute 1 through 27 is excluded).
This helps to see if there is any noticeable shift in the momentum of the game after a goal.
Findings
- Overall City has dominated possession. The cumulative possession delta was always negative (= in favor of City) in Figure 1.
- When the cumulative possession difference was reset after each goal scored (Figure 2), we see that Bolton tried to take the initiative after City took the lead in Min 26. They really pushed hard after City scored the 0-2, pulling one back within 2 minutes of City’s 2nd goal.
- Bolton continued to push for an equalizer until City scored the 1-3 right after the half-time.
- Bolton enjoyed more possession as they searched for a goal and did a substitution at min 60 (an attacking midfielder for a holding midfielder) – it seems like the move paid off as they scored 2-3 in min 62.
- Bolton continued to push for an equalizer. City subbed out Aguero for Tevez, both attacking players but Tevez is better at playing a deeper role and hold up the ball.
- As the game progressed Bolton switched D.Pratley for Chris Eagles (probably a shift in attacking style) and City responded with a defensive move by subbing out Dzeko for Adam Johnson
- Those two moves by City helped them restore control. Towards the end, City subbed out attacking midfielder David Silva for fullback Zabaleta, a defender to secure the result in the dying minutes.
This is a very quick and simple interpretation & visualization of the moment shifts. All feedback is welcome.


jbrisson
/ September 24, 2012Great, great job! Figure 2 is just impressive. You could just SEE lost of momentum, for example in the area that led to subst at 60th minute.That is key for realtime analytics as coaches would be able to SEE KPIs in complementarity as what they see/feel on the field. A very promising area imho.
Ravi Ramineni
/ September 24, 2012Thanks! I am working on something more detailed. Will post it here when ready.
Stefan
/ January 2, 2013I wrote a similar comment on SoccerStatiscally… would love to see both teams’ SHOTS on the visual..perhaps this would reinforce the importance of momentum around the time a team scores, and I would imagine, also show mini-shifts in momentum where a team may be playing mostly in the opponent’s half but conceed several counter attacks in quick succession.
Just watching Tottenham-Reading from New Year’s Day, around the 60th-70th minute was a good example: Tottenham were leading 2-1 and dominating possession, then Reading created at least 3 good chances but did not take them. Tottenham staved off the mini-momentum shift and scored again to go 3-1 up and win the game.
——- From my perspective (coaching/playing), strong data around this could offer a simple rule Eg: if you concede 3 shots in a row, slow the game down, make sure then next shot it yours etc. As players we sense when we’re in trouble, but the game sometimes moves forward without us being able to control it. In the end, good work with data could allow us to be more conscious of these key moments as they’re happening.
Ravi Ramineni
/ January 2, 2013Thanks for the feedback. Agree with your observations. I am working on something more elaborate which looks at shots and a few other variables. It might be a couple of months before I publish it though.